
Earlier this year, FeedbackWhiz introduced the new Walmart integration with FeedbackWhiz Profits. The first stage of Walmart integration with FeedbackWhiz’s powerful ecommerce accounting software included sales data comparison cards and top products reports.
Those features for Walmart sales have since been heavily expanded upon with an upgraded dashboard, weekly and monthly profitability reports, and individual product profit data. In this post, we’ll cover all of the new FeedbackWhiz Profit Analytics updates that help to make this tool an outstanding accounting solution for Walmart Marketplace sellers.
Improved Walmart Profits Dashboard
When you open your FeedbackWhiz account, select your Walmart account as your marketplace and go to Profits > Dashboard.
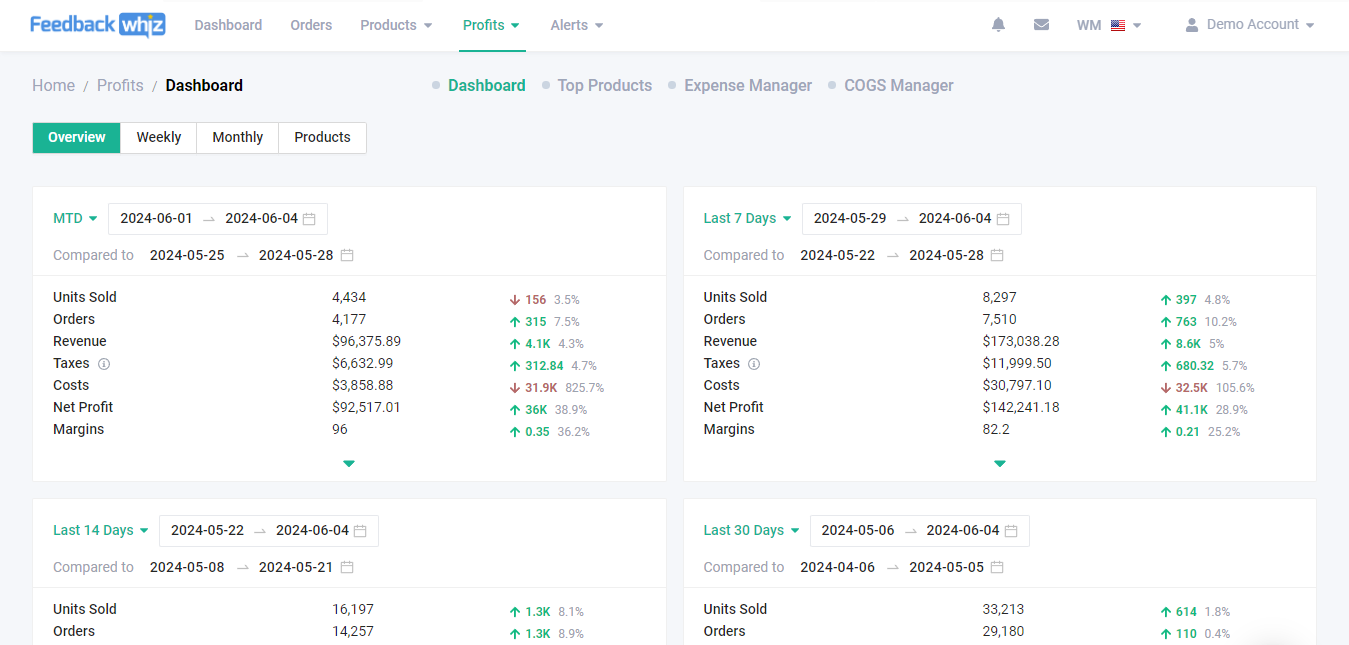
You will still be able to see the key data cards that debuted earlier this year, displaying the following sales data for your selected time periods:
- Units Sold
- Orders
- Revenue
- Taxes
- Costs
- Net Profit
- Margins
In addition to these cards, you will now also be able to view all of your profit data on an attractive, customizable and colorful chart in the “Quick Overview” section.
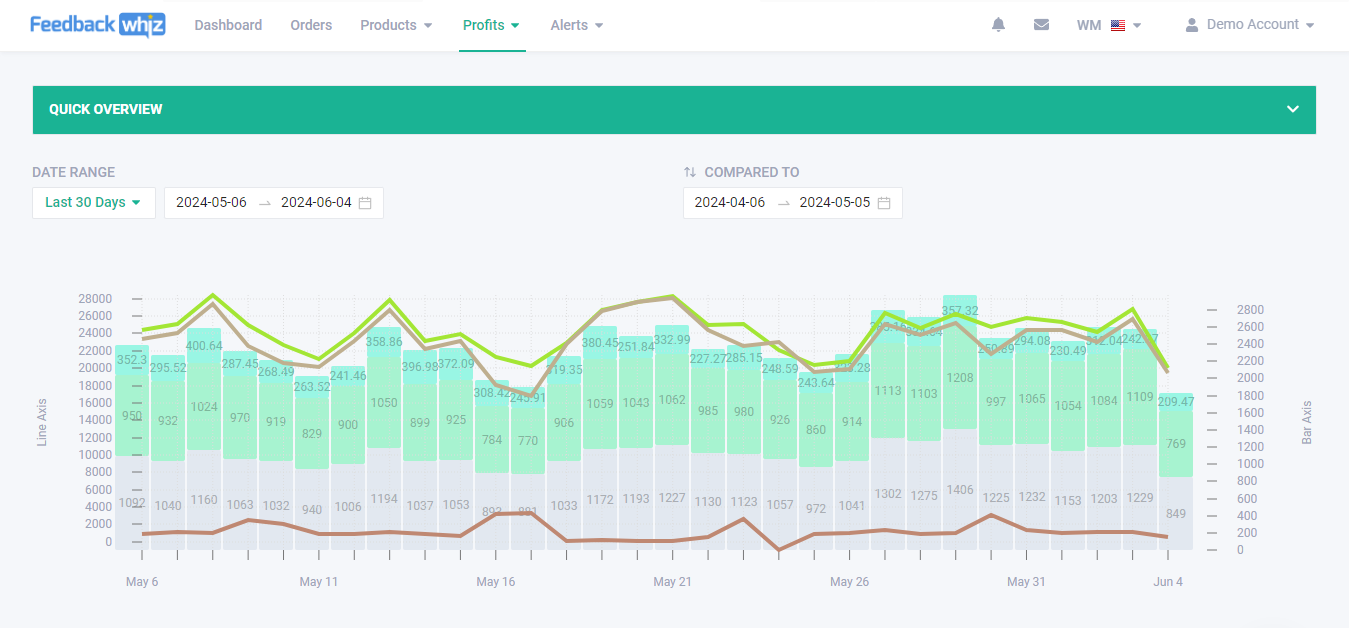
Dashboard Quick Overview Customization Options Available
Any good ecommerce accounting software lets you highlight the metrics that matter most to your business. Each of the following 20 data points is displayed on the dashboard and can be organized in whatever order you prefer:
- Units Sold
- Orders
- Shipping
- Unique Buyers
- Revenue
- Sales
- Custom Revenue
- Taxes
- Costs
- Refunds
- Walmart Commission
- Walmart Fulfillment
- Walmart Fees
- Inventory Reimbursement
- Other Transactions
- Miscellaneous Fees
- Custom Expenses
- Cost of Goods Sold
- Net Profit
- Margins
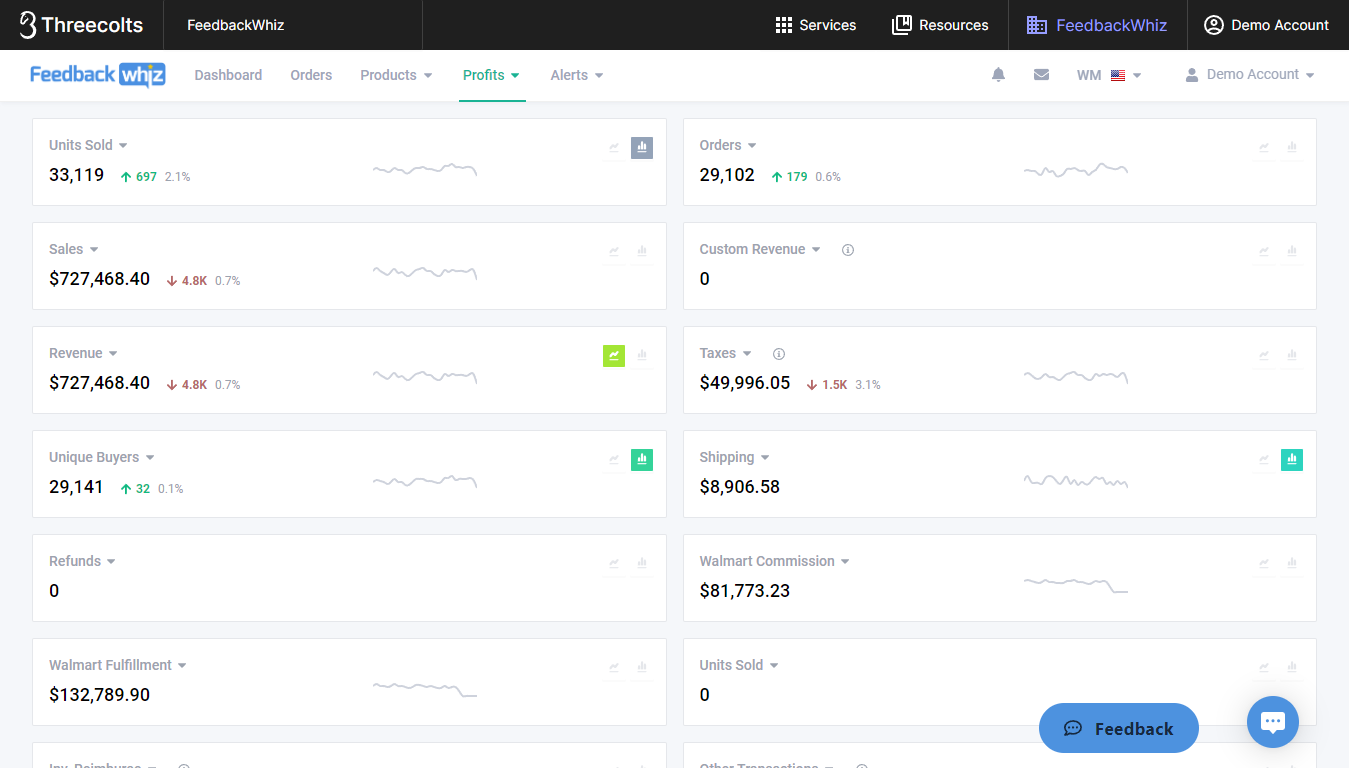
All 20 of the boxes displaying these data points also give you the option to toggle a line graph and bar graph for the Quick Overview on or off, and each box has a different color attached to it.
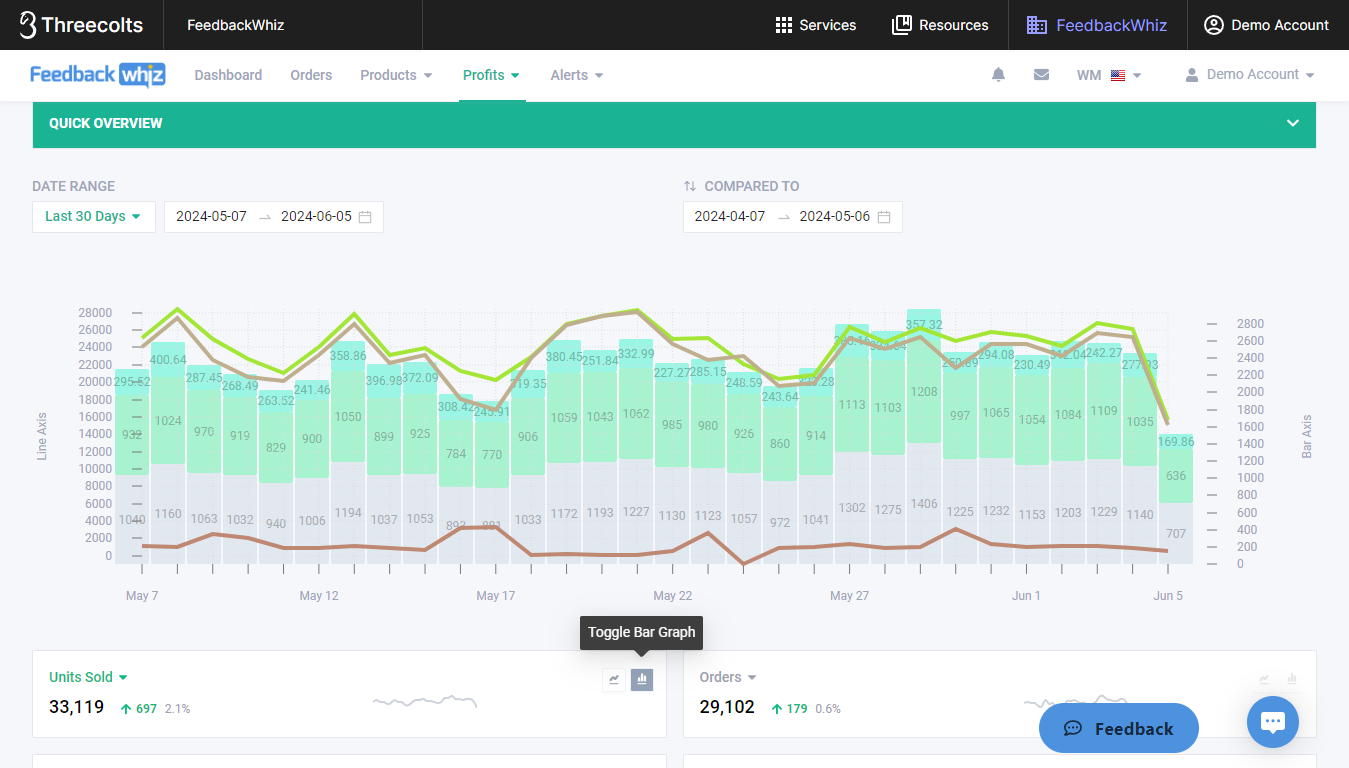
Above: The Quick Overview chart with the Units Sold bar graph enabled. Note that the Toggle Bar Graph button is grey to show the corresponding color for Units Sold in the chart.
Below: The same chart once the Units Sold bar graph has been disabled.

This means that you have control over exactly what data shows up on your Quick Overview chart and what color and graph types these statistics are displayed in. (For example, if you want grey to represent Refunds instead of Units Sold, simply click on Units Sold and switch it to Refunds.) All of the Walmart profit statistics in this section can be displayed in a customizable date range, with performance metrics compared to any other date range that you choose as well.
Weekly and Monthly Profitability Reports
Moving on from the “Overview” page that the Profits dashboard opens to, you can now also navigate to weekly and monthly profitability reports using the “Weekly” and “Monthly” tabs on the dashboard.
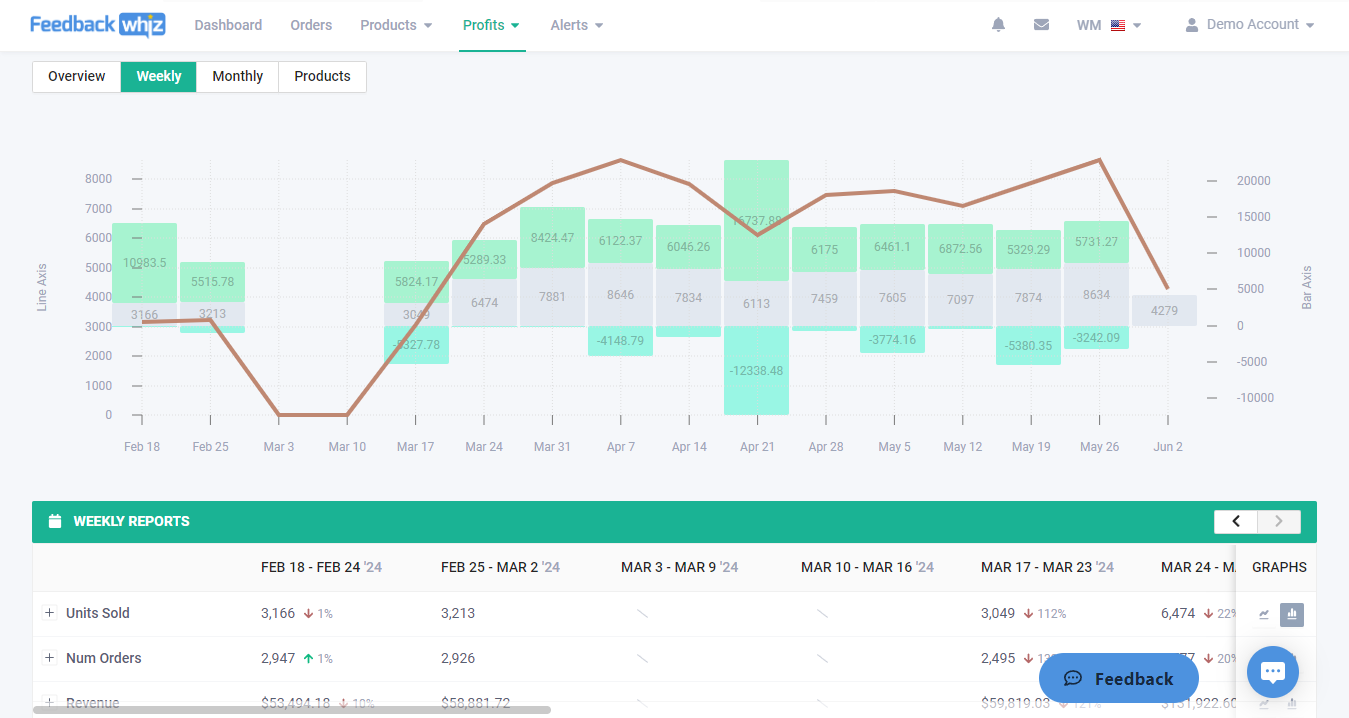
These reports give you a quick glance at all of the following Walmart profit data, both listed and on a colorful chart:
- Units Sold
- Walmart Fulfilled Units
- Seller Fulfilled Units
- Number of Orders
- Unique Buyers
- Revenue
- Sales
- Custom Revenue
- Taxes
- Refunds
- Number of Refunds
- Walmart Fees
- Other Fees
- Inventory Reimbursements
- Miscellaneous Fees
- Expenses
- Cost of Goods Sold
- Costs
- Net Profit
- Margins
As was the case on the Quick Overview, users have the option to toggle a bar or line graph on or off for each of these data points. Each statistic is displayed in a different color so that you can easily see how your Walmart Marketplace storefront is performing week-over-week or month-over-month.
Walmart Product Profitability Review
Using the dashboard’s “Products” tab, you can now see how each individual product that you sell is performing on Walmart.
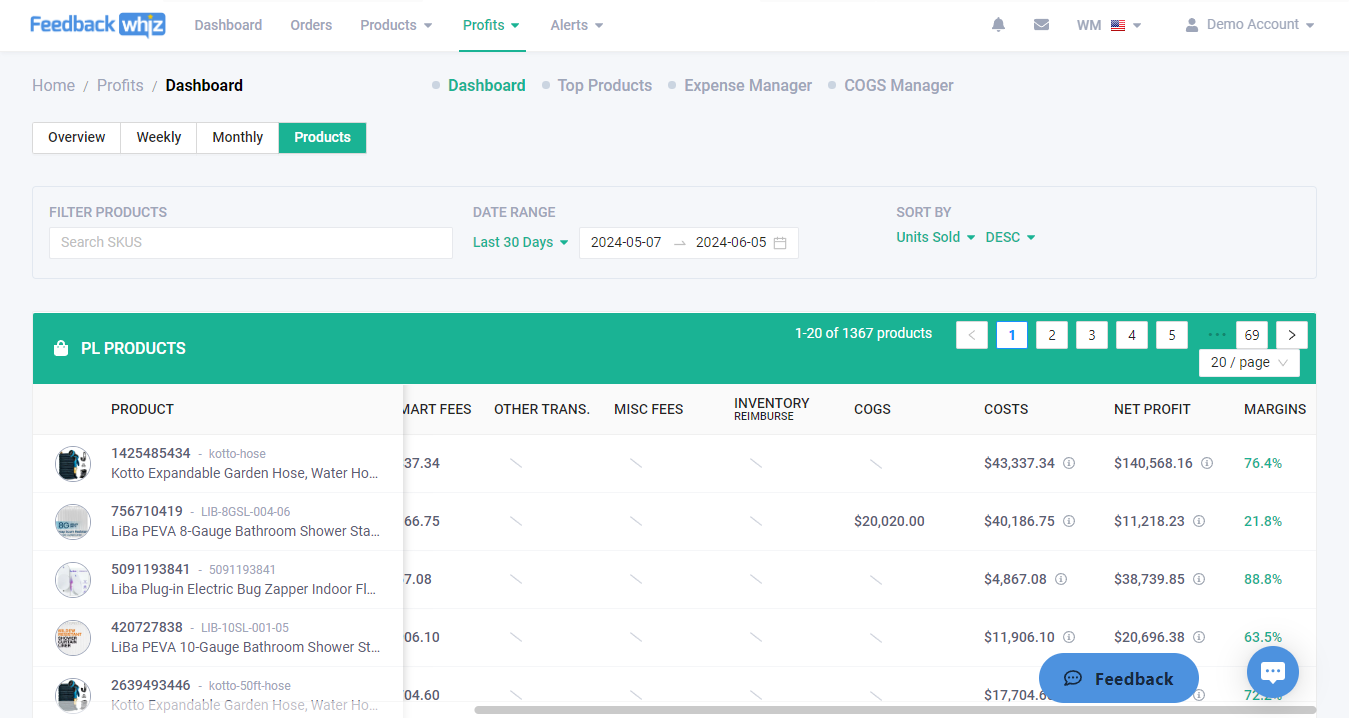
The following data is displayed on a per-product basis:
- Price
- Number of Orders
- Units Sold
- Taxes
- Revenue
- Refunds
- Walmart Fees
- Other Transactions
- Miscellaneous Fees
- Inventory Reimbursements
- Cost of Goods Sold
- Costs
- Net Profit
- Margins
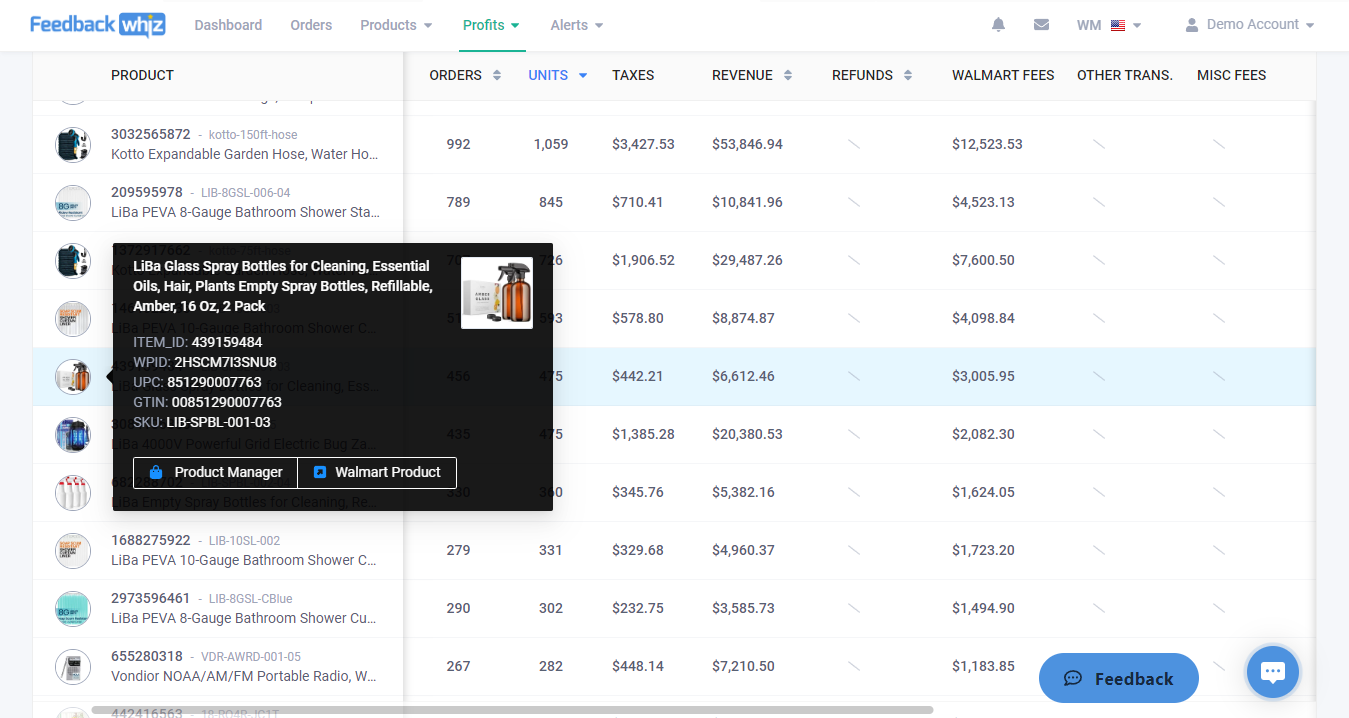
Clicking on a product’s icon displays its listing title, ITEM_ID, WPID, UPC, GTIN, and SKU. This product info screen also includes links to the item in your FeedbackWhiz product manager and to its product page on the Walmart Marketplace.
All of the features highlighted in this article and more are also available for your Amazon marketplace in the FeedbackWhiz Profits accounting tool. Whether you sell on Amazon, Walmart, or both, you won’t find a more comprehensive and user-friendly inventory tracking and accounting solution than this one. Start your free trial today.
0 Comments